Visualizations can potentially misrepresent information if they ignore or hide the uncertainty that are usually present in the data. While various techniques and tools exist for visualizing uncertainty in scientific visualizations, there are very few tools that primarily focus on visualizing uncertainty in graphs or network data. With the popularity of social networks and other data sets that are best represented by graphs, there is a pressing need for visualization systems to show uncertainty that are present in the data. This paper focuses on visualizing a particular type of uncertainty in graphs - we assume that nodes in a graph can have one or more attributes, and each of these attributes may have an uncertainty associated with it. Unlike previous efforts in visualizing node or edge uncertainty in graphs by changing the appearance of the nodes or edges, e.g. by blurring, the approach in this paper is to use the spatial layout of the graph to represent the uncertainty information. We describe a prototype tool that incorporates several uncertainty-to-spatial-layout mappings and describe a scenario showing how it might be used for a visual analysis task.
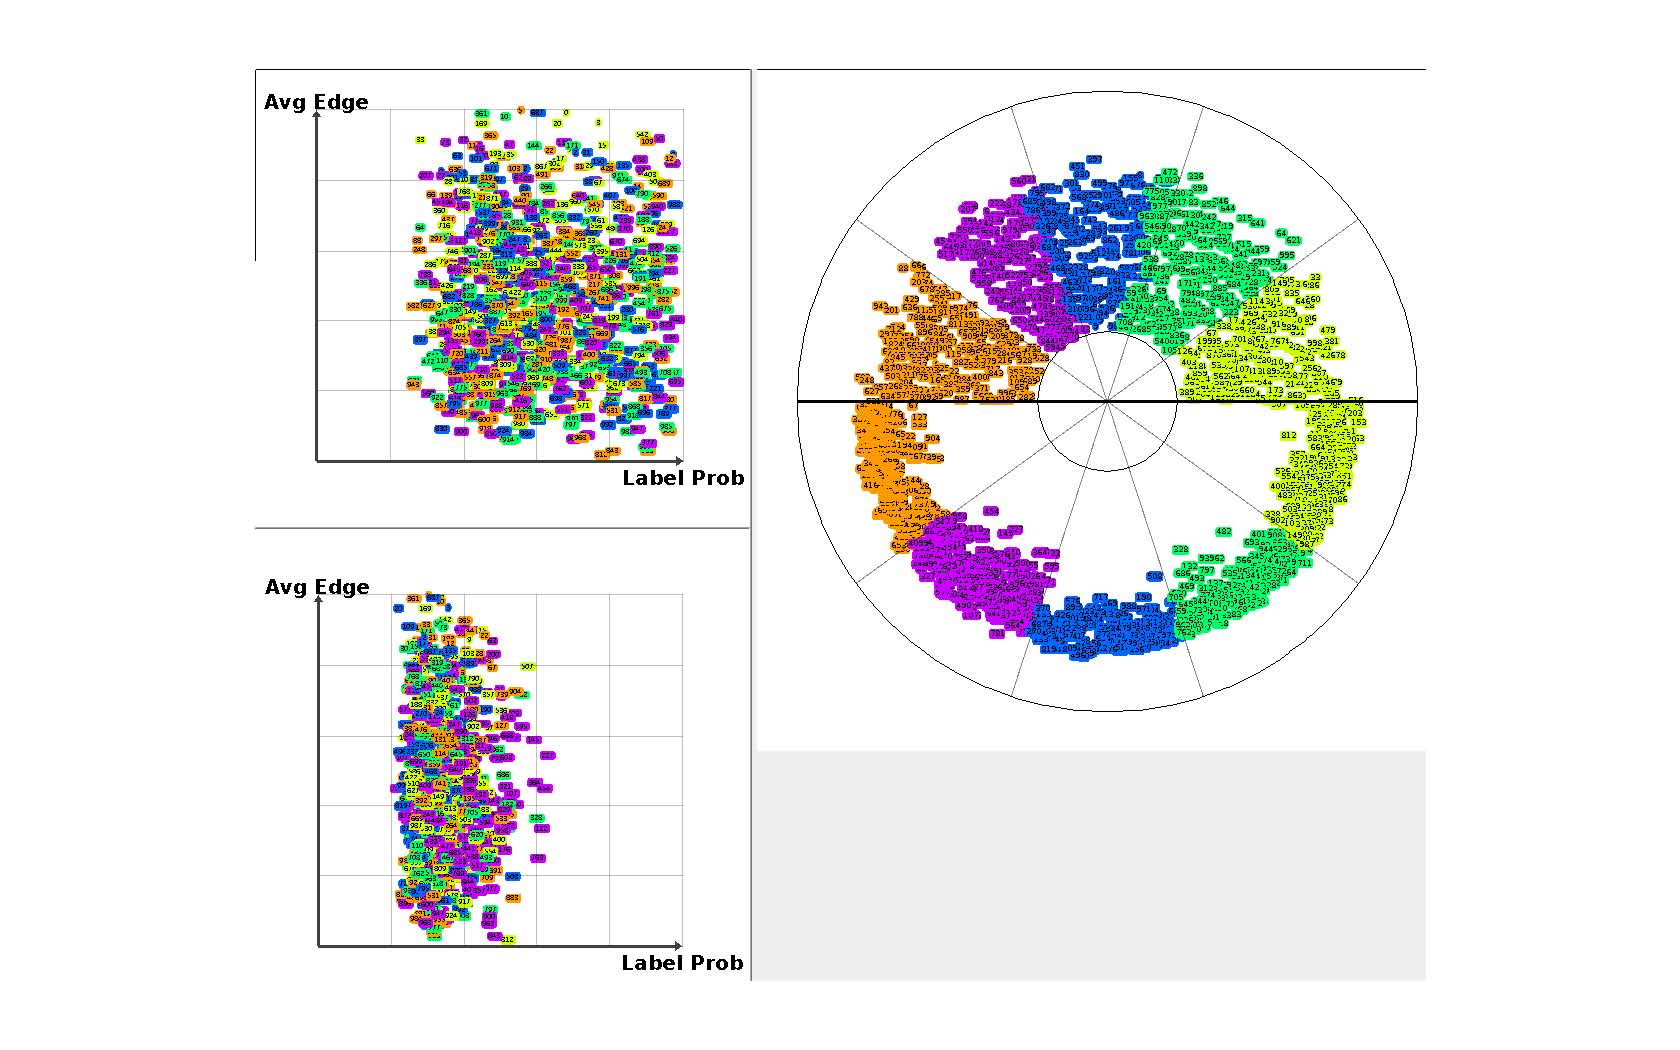 Linked display of scatter plots and bullseye.
The scatter plot on the top left shows that this graph's distribution of uncertainty values are skewed
to the right, but the attribute values themselves are uniformly distributed. The scatter plot on the lower
left shows that
the second graph's uncertainty values are skewed to the left and has a smaller spread.
The bullseye on the right shows
an alternative way to view the distribution of values categorized by type..
Linked display of scatter plots and bullseye.
The scatter plot on the top left shows that this graph's distribution of uncertainty values are skewed
to the right, but the attribute values themselves are uniformly distributed. The scatter plot on the lower
left shows that
the second graph's uncertainty values are skewed to the left and has a smaller spread.
The bullseye on the right shows
an alternative way to view the distribution of values categorized by type..
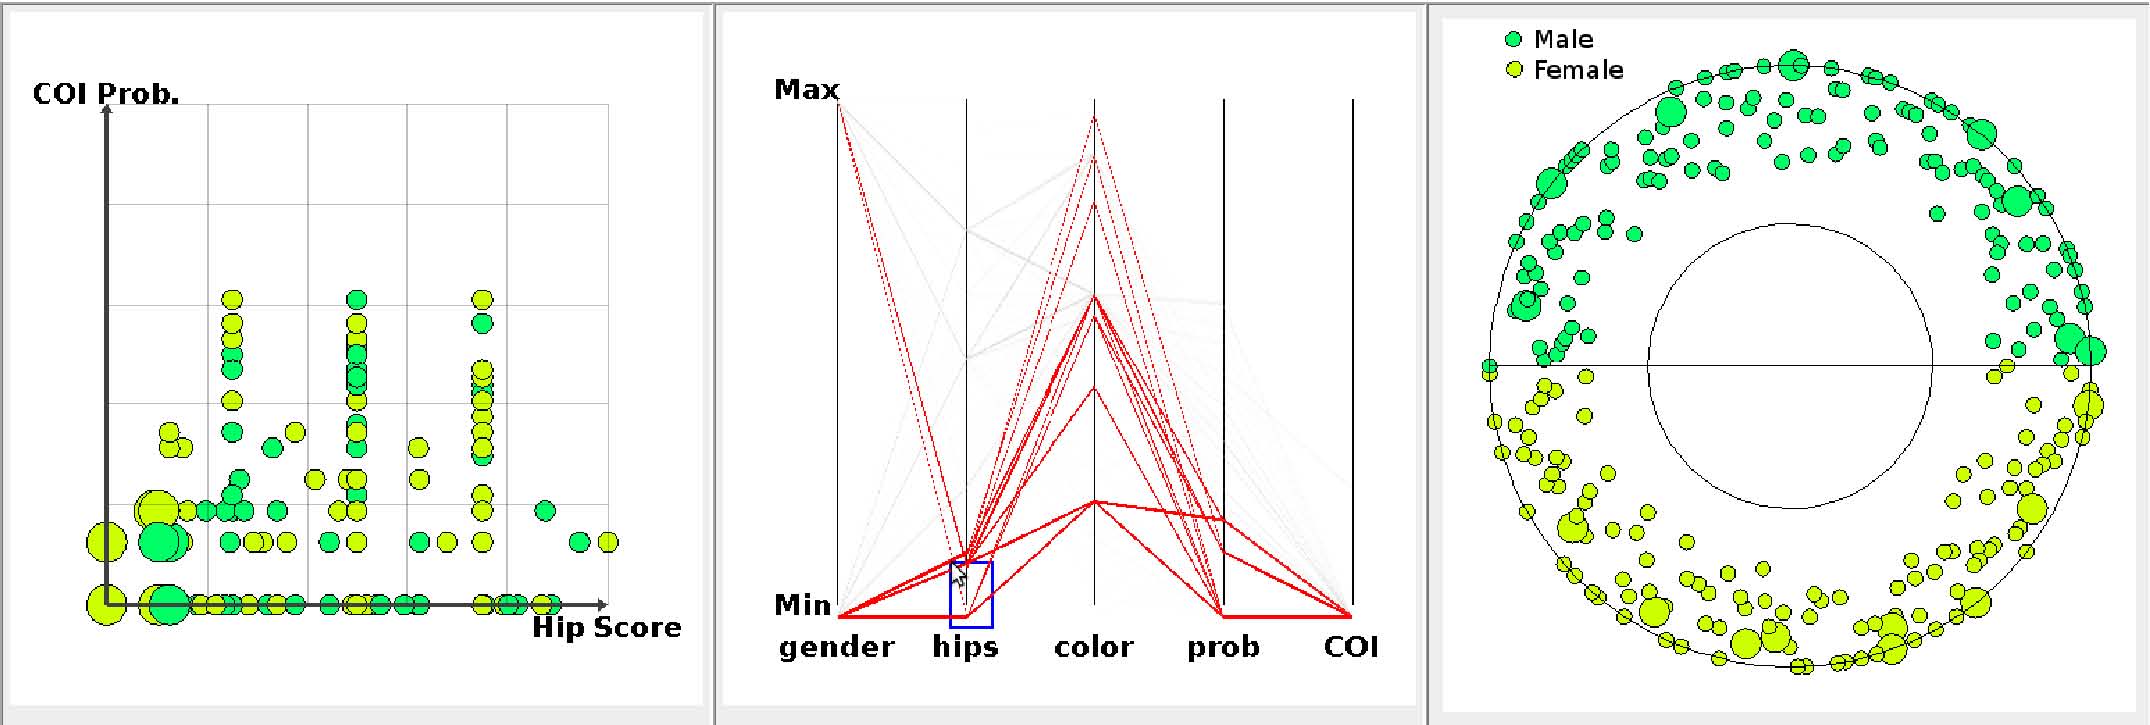 Linked display of scatter plot, parallel coordinates, and bullseye.
Selected points in the blue box are displayed as larger nodes in the
scatter plot and bullseye displays.
Linked display of scatter plot, parallel coordinates, and bullseye.
Selected points in the blue box are displayed as larger nodes in the
scatter plot and bullseye displays.