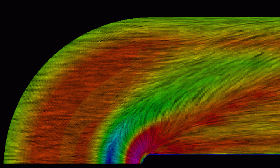
This is the steady state simulation of the bluntfin dataset.
The visualization was generated using PLIC and pseudo-colored
with the velocity magnitude.
Blue regions indicate low velocity magnitude and red regions indicate
high velocity magnitude.
The animation is variable speed; regions of high velocity move
faster than regions of low velocity.
 Steady flow simulation for the bluntfin [32Mb]