Map Projections and Distortion Visualization

Floating Ring: A New Tool for Visualizing Distortion
in Map Projections
Abstract:
We present a new method for interactive visualization of
distortion in map projections.
The central idea is a floating ring on the globe that can be
interactively positioned and scaled.
As the ring is manipulated on the globe,
the corresponding projection of the ring is distorted
using the same map projection parameters.
We apply this method to study areal and angular distortion.
This method is particularly useful when analyzing large
geographical extents (such as in global climate studies)
where distortions are significant,
as well as visualizations for which information is geo-referenced
and perhaps scaled to the underlying map.
It serves as a reminder that distortions exist in maps
and provides information about the degree,
location, and type of distortion.
Papers:
This paper entitled:
Floating Ring: A New Tool for Visualizing Distortion in Map Projections
was presented at the
CGI'98 conference
and is available by clicking
here .
An expanded paper describing the interactive map projection
system and the distortion rings in both 2D and 3D will be
published by Computers and Geosciences. A preprint version
is available
here.
Educational Software for Map Projections
The following map projection software is publicly available
as long as it is not used for profit, and acknowledgements
should be made to University of California and to the USGS.
The software is written in C++.
OpenGL is used for graphics rendering, while
FLTK is used for the graphical user interface.
The actual coordinate transformations are done by the
GCTP package from
USGS .
Windows and NT versions:
Executable
315kb
Coastline data . 1.2mb
Sun Solaris version:
Executable
1.3mb
Coastline data . 485kb
SGI IRIX version:
coming soon...
XXXmb
Coastline data . 485kb
Features:
The program supports three general forms of map
projections -- conical, cylindrical, and planar.
It provides a graphical user interface for the user to
select the type of projection and other parameters.
Since the coastline is quite large (485kb binary or 1.2mb ascii)
and can slow down the rendering, the user can hide the coastline
until a desired mapping has been selected.
Images
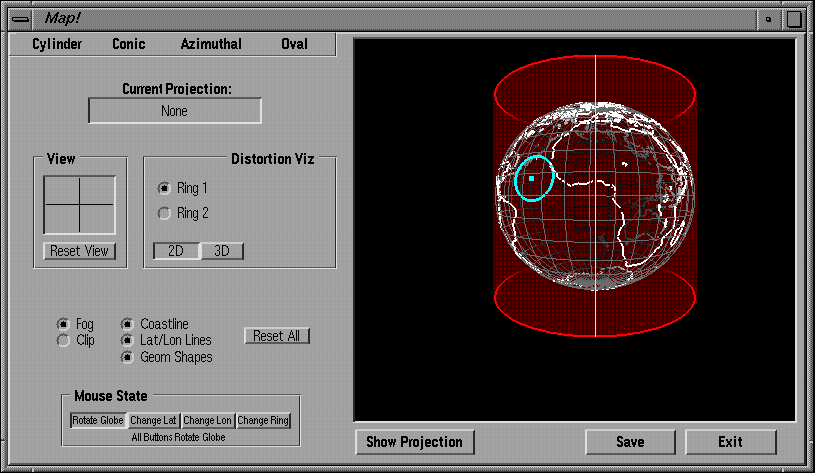
The Globe Window
Shown is the globe with coastline, and a cylinder as the geometric shape,
indicating a cylindrical projection will be produced.
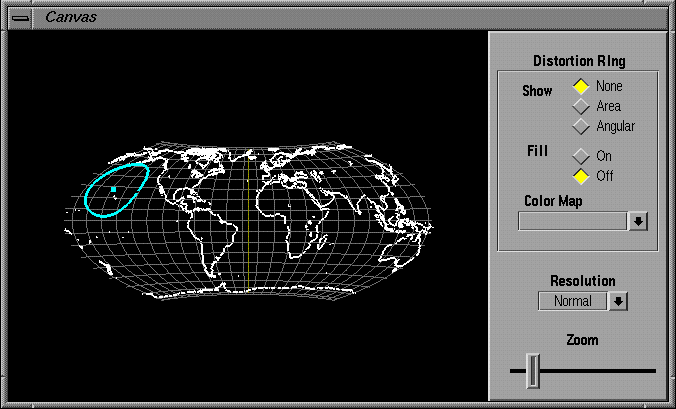
The Projection Window
Shown is the Wagner VII projection, a pseudo azimuthal projection.
The cyan colored ring is the Floating Ring, which appears distorted
from its original circular shape (on the globe) in both size and shape.
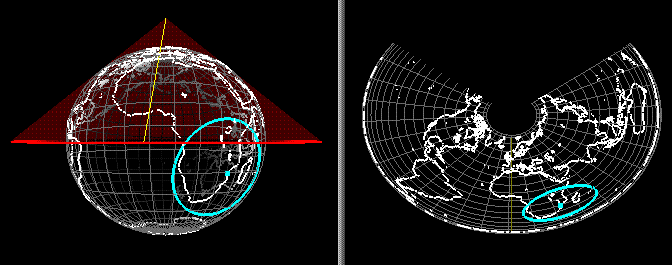
Conic Projection and Floating Ring
Parts of the Globe and Projection window are shown. The red cone
is an interactive visual tool that indicates a conic projection,
shown at right (Albers Equal-Area Projection).
Feedback:
Please send us your feedback, comments, suggestions, etc.
Also send us email if you want to be notified of upgrades.
Related Sites:
 Return to AVIS home page.