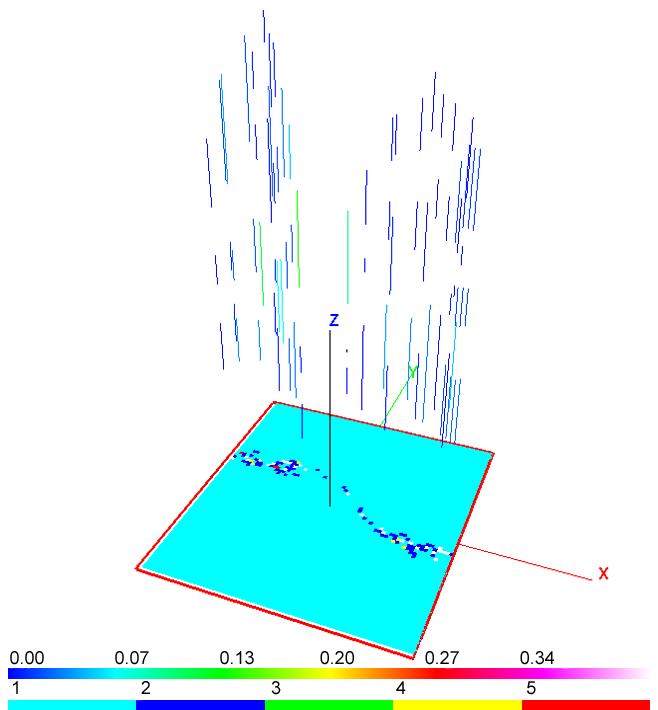
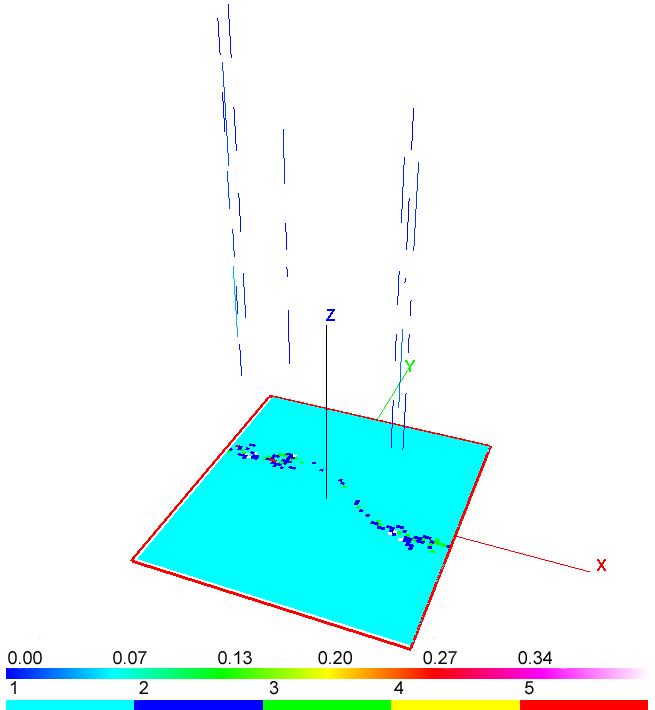
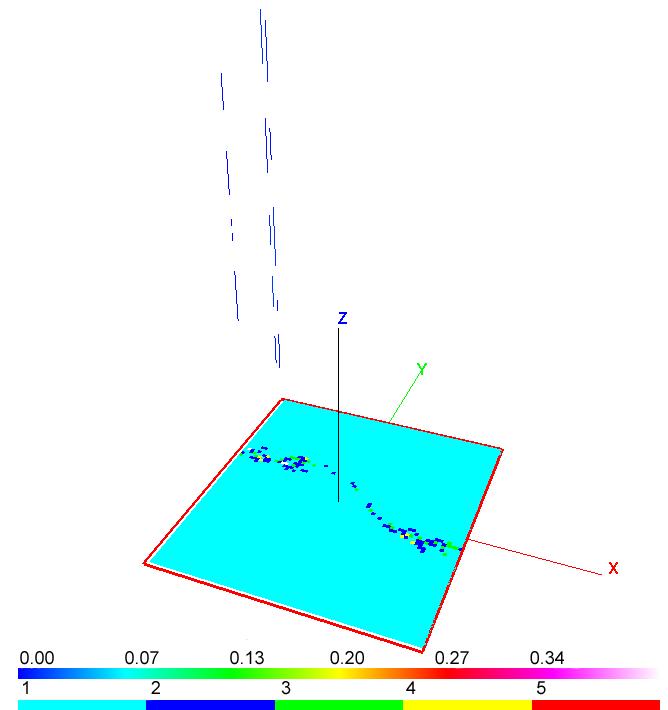
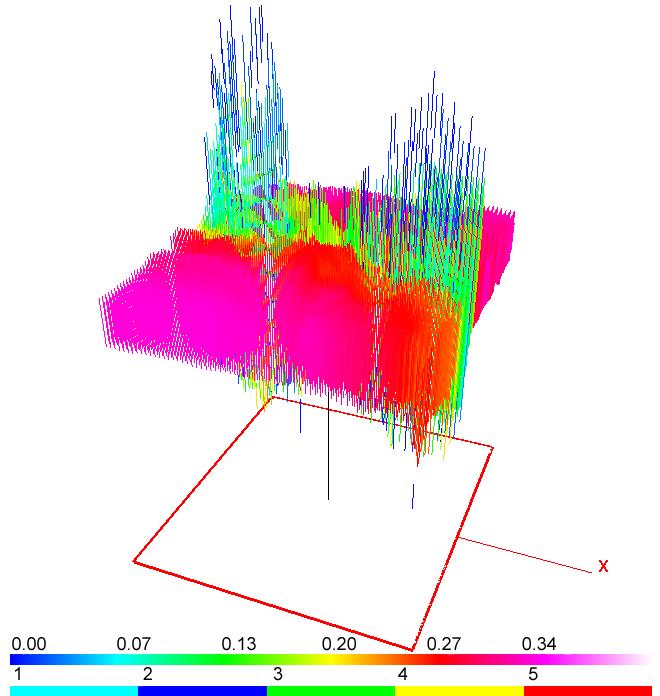
Box plot is a compact representation that encodes the minimum, maximum, mean, median, and quartile information of a distribution. In practice, a single box plot is drawn for each variable of interest. With the advent of more accessible computing power, we are now facing the problem of visualizing data where there is a distribution at each 2D spatial location. Simply extending the box plot technique to distributions over 2D domain is not straightforward. One challenge is reducing the visual clutter if a box plot is drawn over each grid location in the 2D domain. This paper presents and discusses two general approaches, using parametric statistics and shape descriptors, to present 2D distribution data sets. Both approaches provide additional insights compared to the traditional box plot technique.
|
|
|
|
|
|
|
|
|