
|
|
Approaches to Uncertainty Visualization | Presenting data in such a manner that users are made aware of the locations and degree of uncertainties. |

|
Verity Visualization: Visual Mappings | Several techniques of presenting data together with uncertainty, which can be applied to both spatial (e.g. surface) and temporal (i.e. animation) domains. |

|
Uncertainty Glyphs | New vector glyphs to visualize uncertain winds and ocean currents. |
| Correction to illustrate technique in small multiples (ala Tufte), glyphs are shown with traditional arrow glyphs compared to new uncertainty glyphs, C.M. Wittenbrink, A.T. Pang, and S. K. Lodha, IEEE Transactions on Visualization and Computer Graphics, Vol. 2, No. 3, Sept. 1996, pages 266-279. Shown here are Figures 9-14 as intended: here. |

|
IFS Fractal Interpolation | New derivations for fractal interpolation in two and three-dimensional scalar data, and new point and polytope rendering algorithms. |

|
Methods for Comparing 3D Surface Attributes | Several methods for analyzing the location extent, magnitude, and manner in which surfaces in 3D differ in their attributes. |
|
|
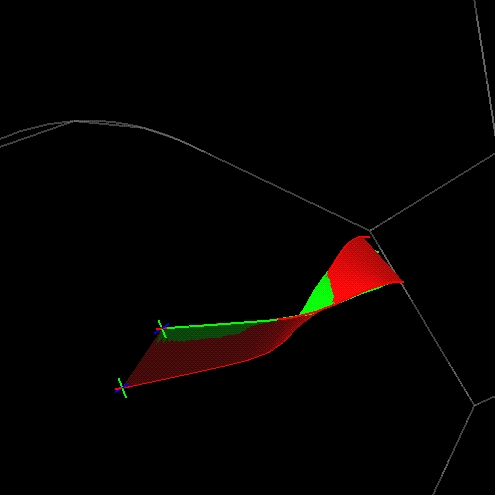
Visualizing Geometric Uncertainty of Surface Interpolants | Several visual methods for analyzing the differences between scattered data interpolants. |

|
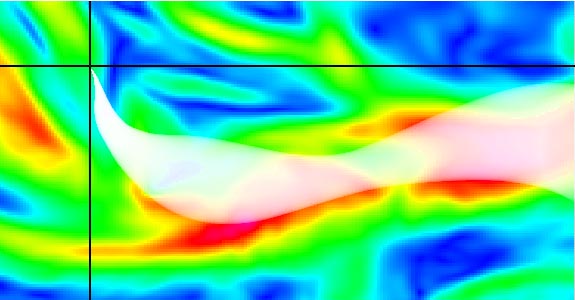
Comparative Streamflow Visualization | UFLOW -- a system for visualizing uncertainty in fluid flow. |
|
Comparative Flow Visualization | Comparative Flow Visualization -- including dense field comparison |

|
Data Quality Issues in Visualization | Comparing interpolation techniques on sparse data sets and discussing how other parameters such as confidence levels and drop-off rates may be incorporated into the visual display. |

|
Data Level Comparison of Volume Rendering | Addressing the issue of uncertainties introduced during the process of direct volume rendering (DVR). |

|
Visualization Tools for Data Assimilation | A suite of visualization tools to aid scientists in performing their data assimilation analyses. |

|
Map Projections and Distortions | A new method for interactive visualization of distortion in map projections. |
|
Data Level Comparison of Wind Tunnel and Computational Fluid Dynamics Data | A data level comparative visualization system for studying computational fluid dynamics data and wind tunnel experimental data. |
|
Variable Precision Camera Calibration | How to do variable precision camera calibration. Necessary step before one can compare 3D models with 2D images. |
|
Pseudo-LIC | Going from streamlines to LIC, and back. |
|
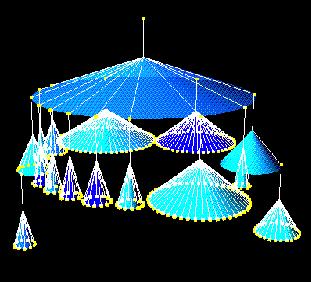
Reconfigurable Disc Trees | A new visualization technique which can alleviate the disadvantages of cone trees significantly for large hierarchies while maintaining its context of using 3D depth. |
|
Uncertainty Discs | Applying RDTs to data with uncertainty. |
|
Comparison of Multiresolution Meshes | Metrics and visualization tools for comparing surface meshes. |
|
2D Distribution Data Sets | Pixel and feature-wise techniques for looking at 2D distributions. |
|
Scalar Volumetric Uncertainty | Visualizing scalar volumetric uncertainty. |
|
Shape Descriptors for PDFs | Non-parametric shape descriptors for spatial multivalued data. |
|
Multi-Value Operators | Representing and visualizing uncertainty with the multi-value data type. |
|
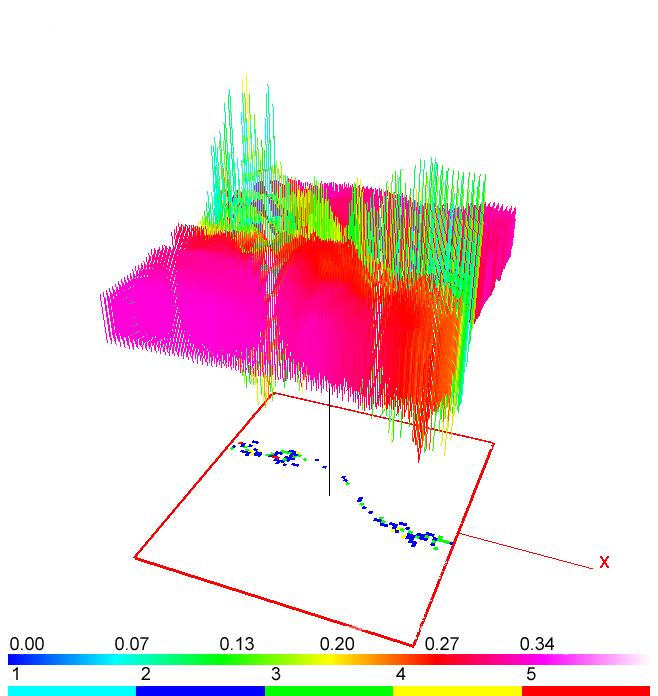
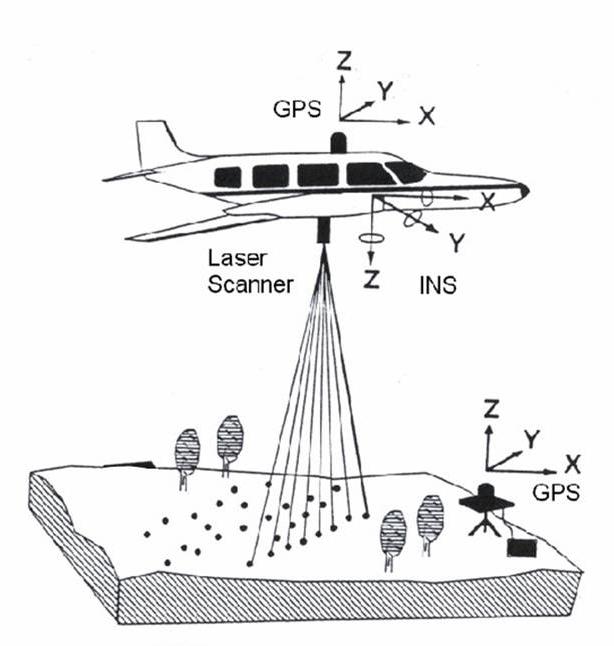
Exploring Multi-Return Airborne Lidar | Application of parametric, non-parametric and operator based approach to multi-return airborne lidar data. |
|
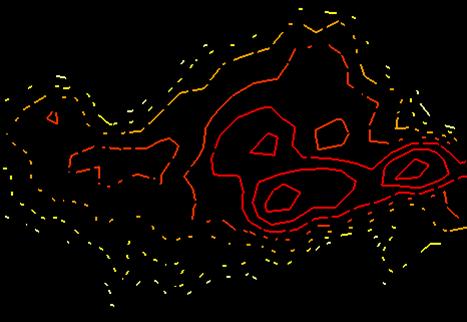
Visualizing Uncertainty in Natural Hazards | Methods and considerations in presenting uncertainty information for natural hazards applications. |
|
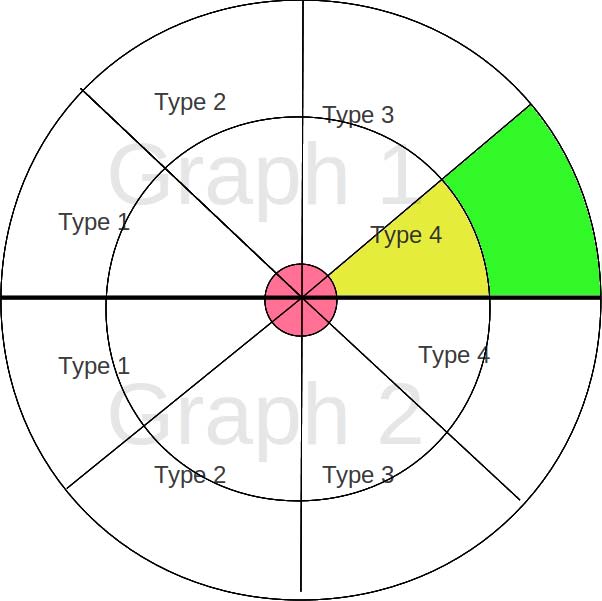
Visualizing node attribute uncertainty in graphs | Visualizing and comparing attributes of graphs using bullseye and comparative columns. |
|
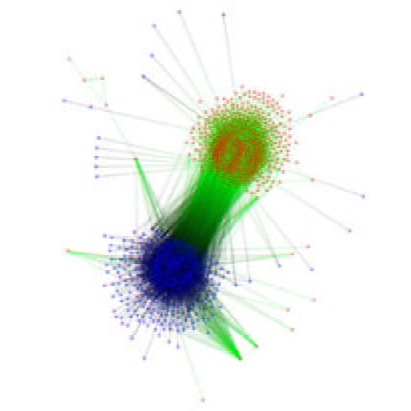
Foundations of Comparative Analytics for Uncertainty in Graphs | Reasoning, comparison, and visualization of graphs with uncertainty information. |
Sponsors:
![]()

![]()
![]()
![]()